Experience Specialist at IKEA
Click on any project to be guided to its section.
Published date: 2024, February
Motivation
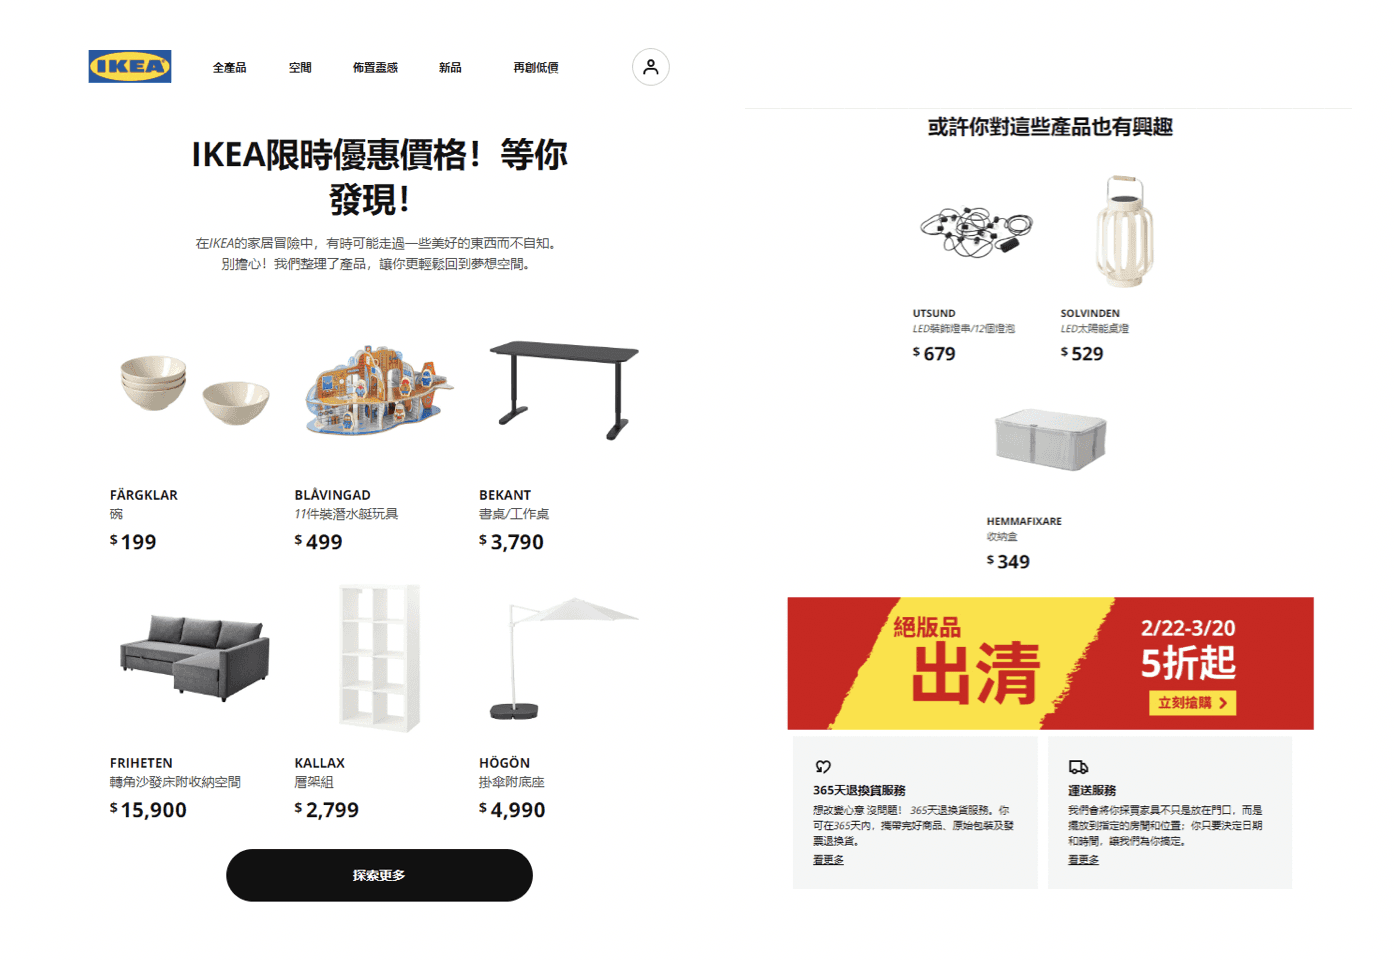
Encouraged potential customers to return to our site to complete their transactions. Additionally, we can increase event exposure through email.
Challenge
It was the first time we utilized triggered emails. Our company has already sent event emails to members. We should consider the frequency and style to ensure consistency with our brand.
Solution
Actively collaborated with cross-functional teams such as the UX team and marketing department to discuss the frequency and style of communication, while also monitoring backend metrics and feedback.
Result
Implemented product view abandonment emails to remind customers to revisit the website. Achieved an open rate of 70.43% and a significant click-through rate of 25.72% with the 'viewed together' strategy.
Learning
Although we lacked past experience to reference, we still tried it. We targeted specific small group for testing, ensuring that any changes would have a significant positive impact on all customers. We then gradually expanded our reach to engage more customers and accumulated data and experience to effectively leverage triggered email in the future.
Published date: 2024, March
Motivation
Enabled online shoppers to select products tailored to their needs, even without the presence of a seller nearby.
Challenge
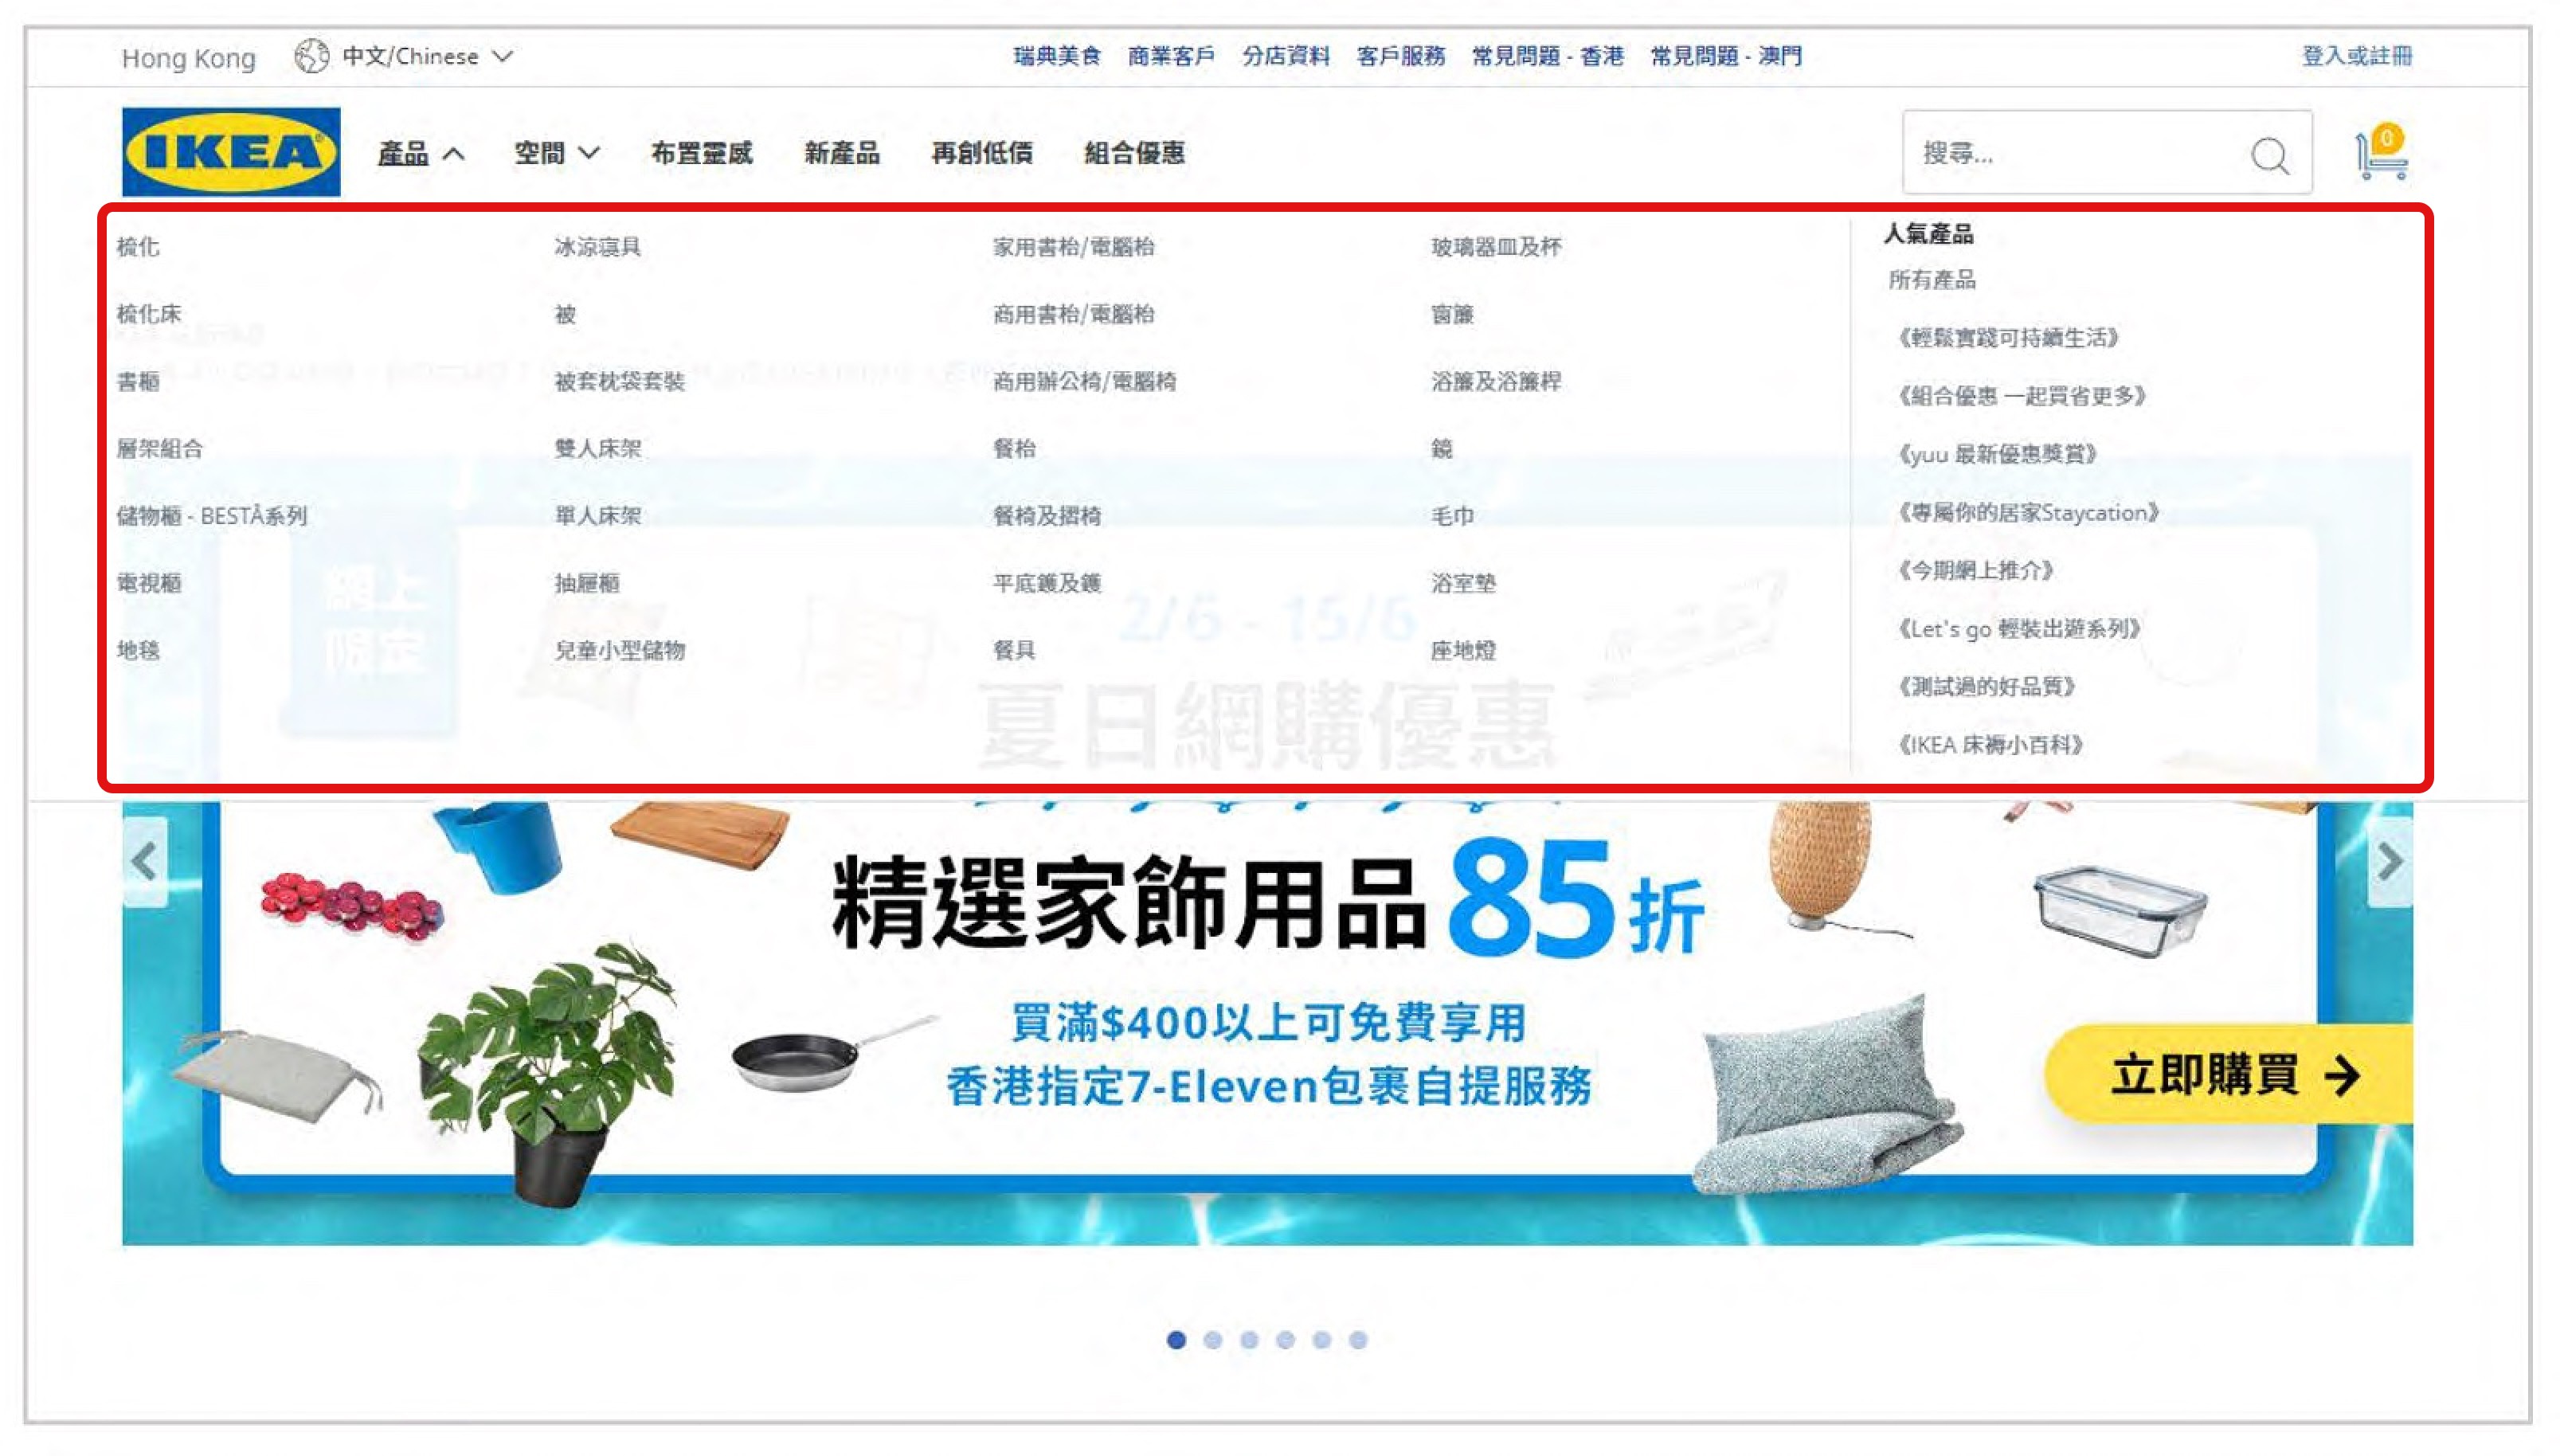
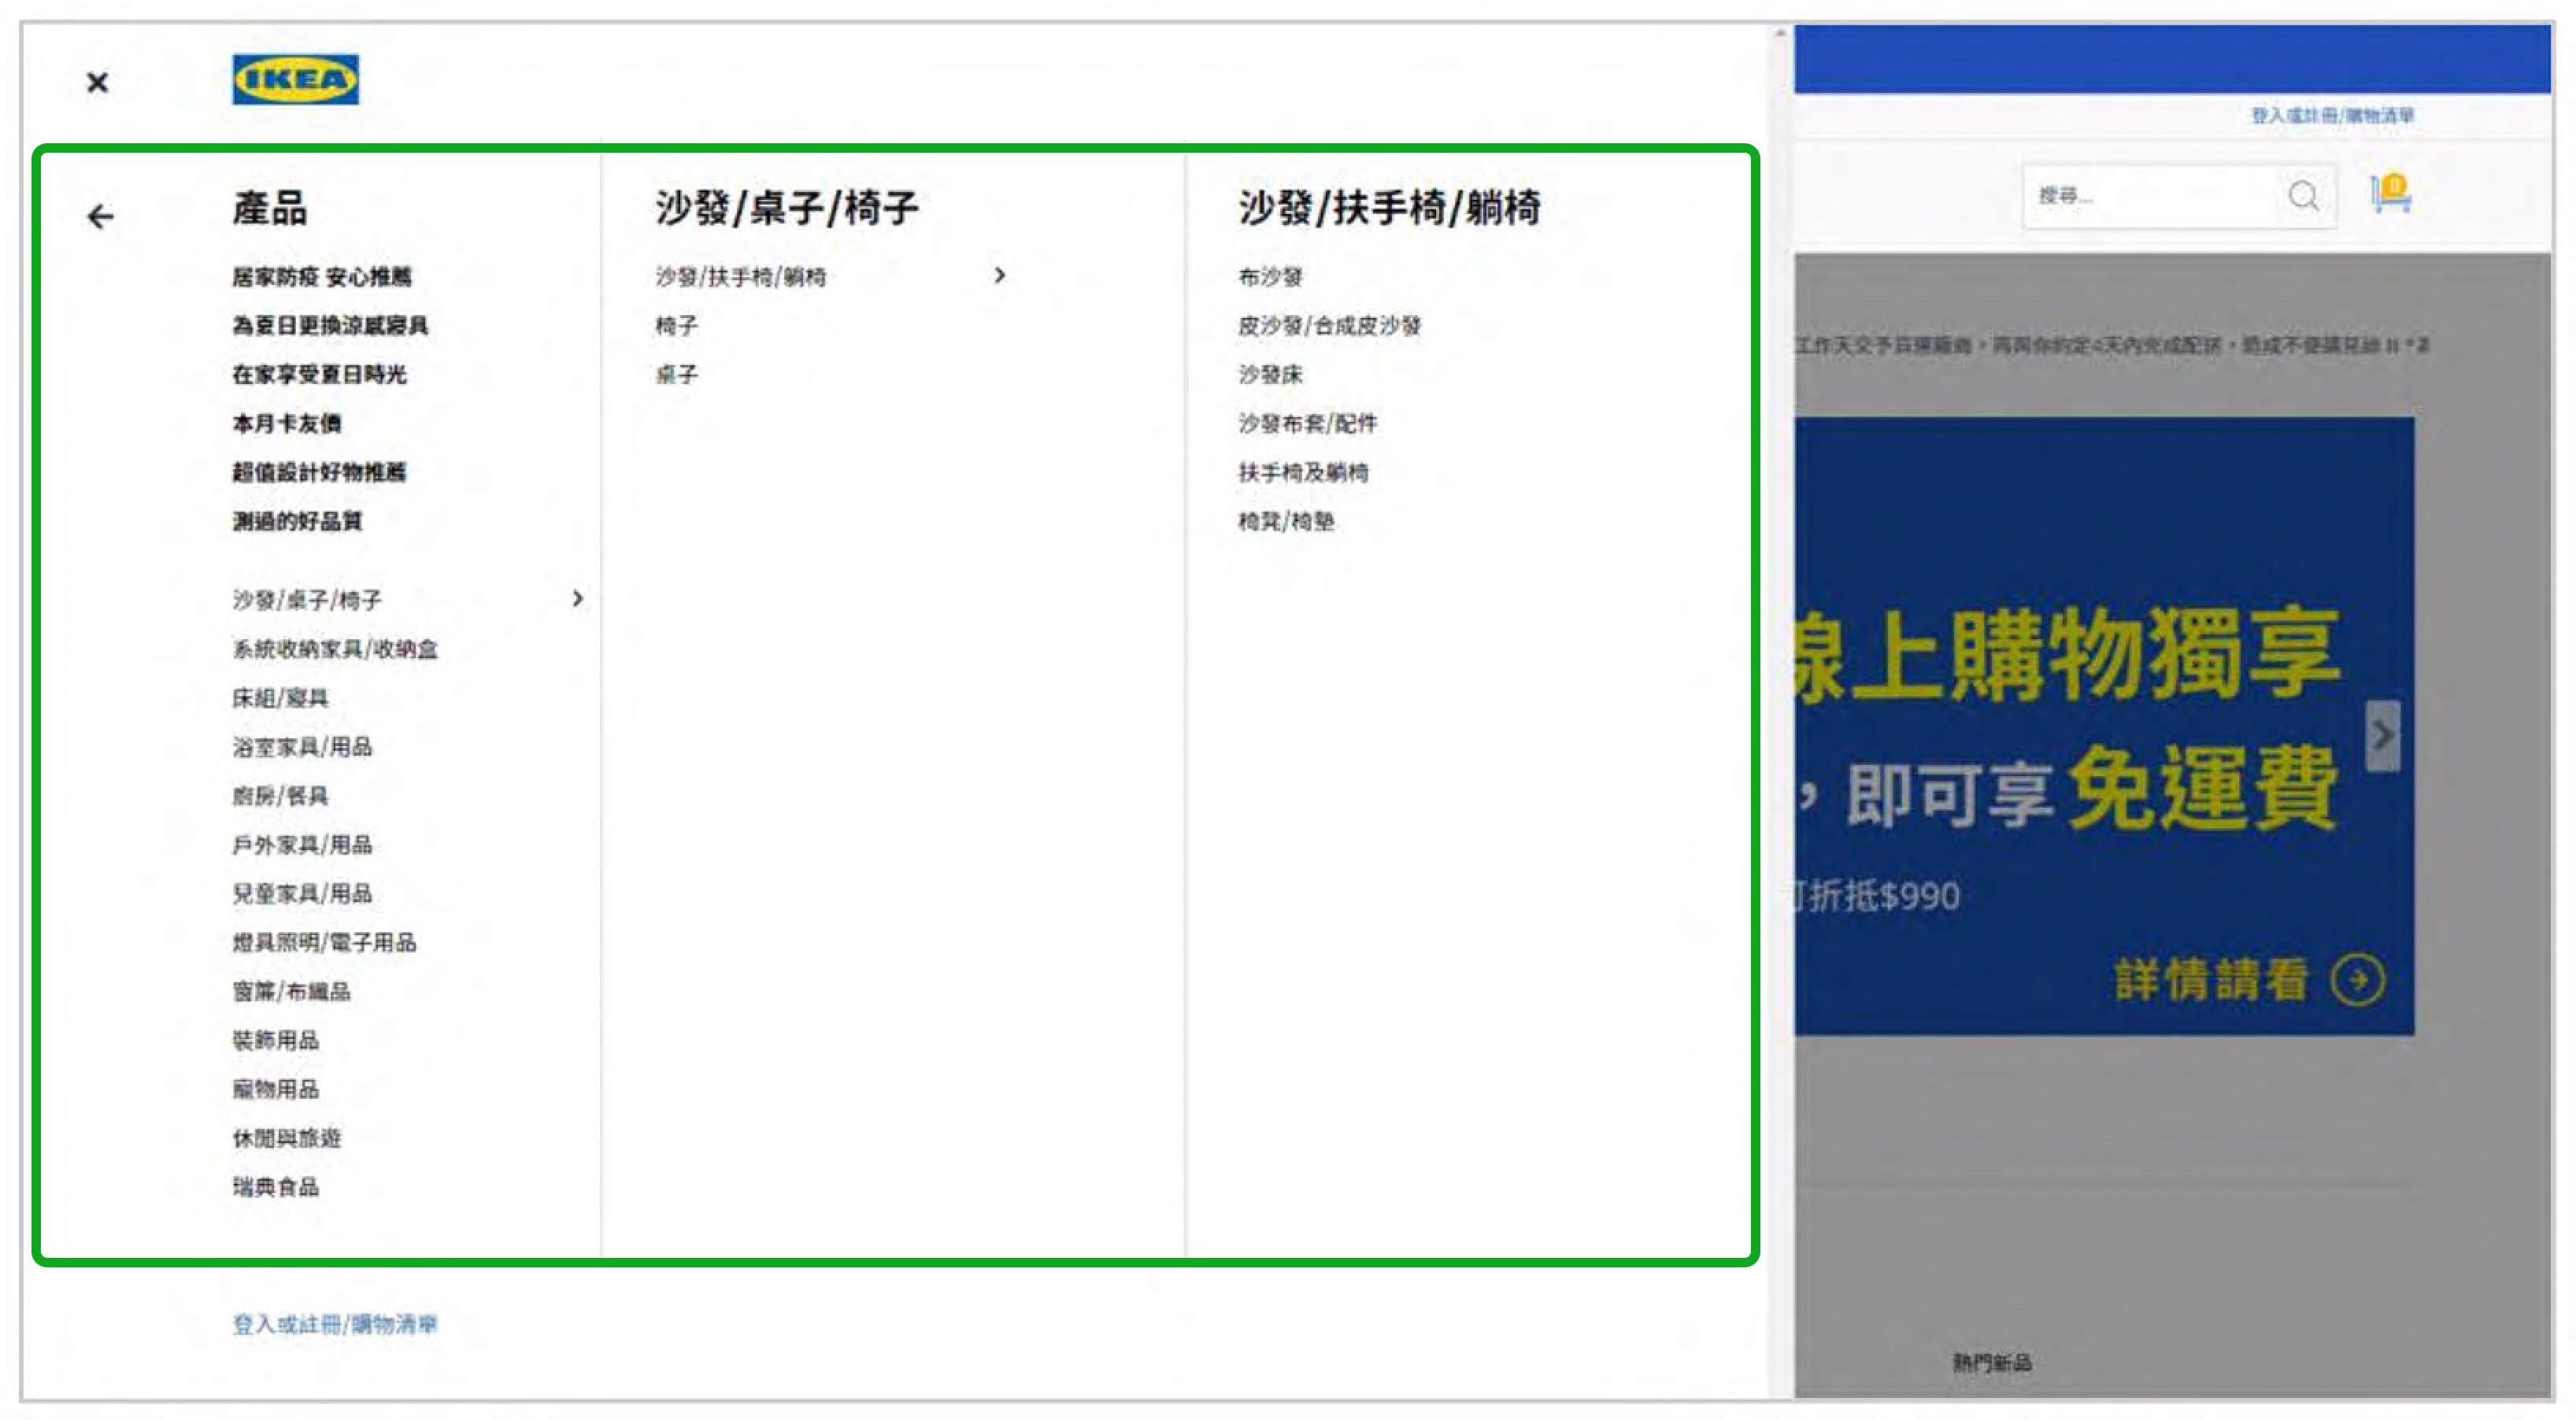
With over 1,200 items spread across four category pages, I needed to find a method to sell sofas even though there was no staff available to assist online customers directly.
Solution
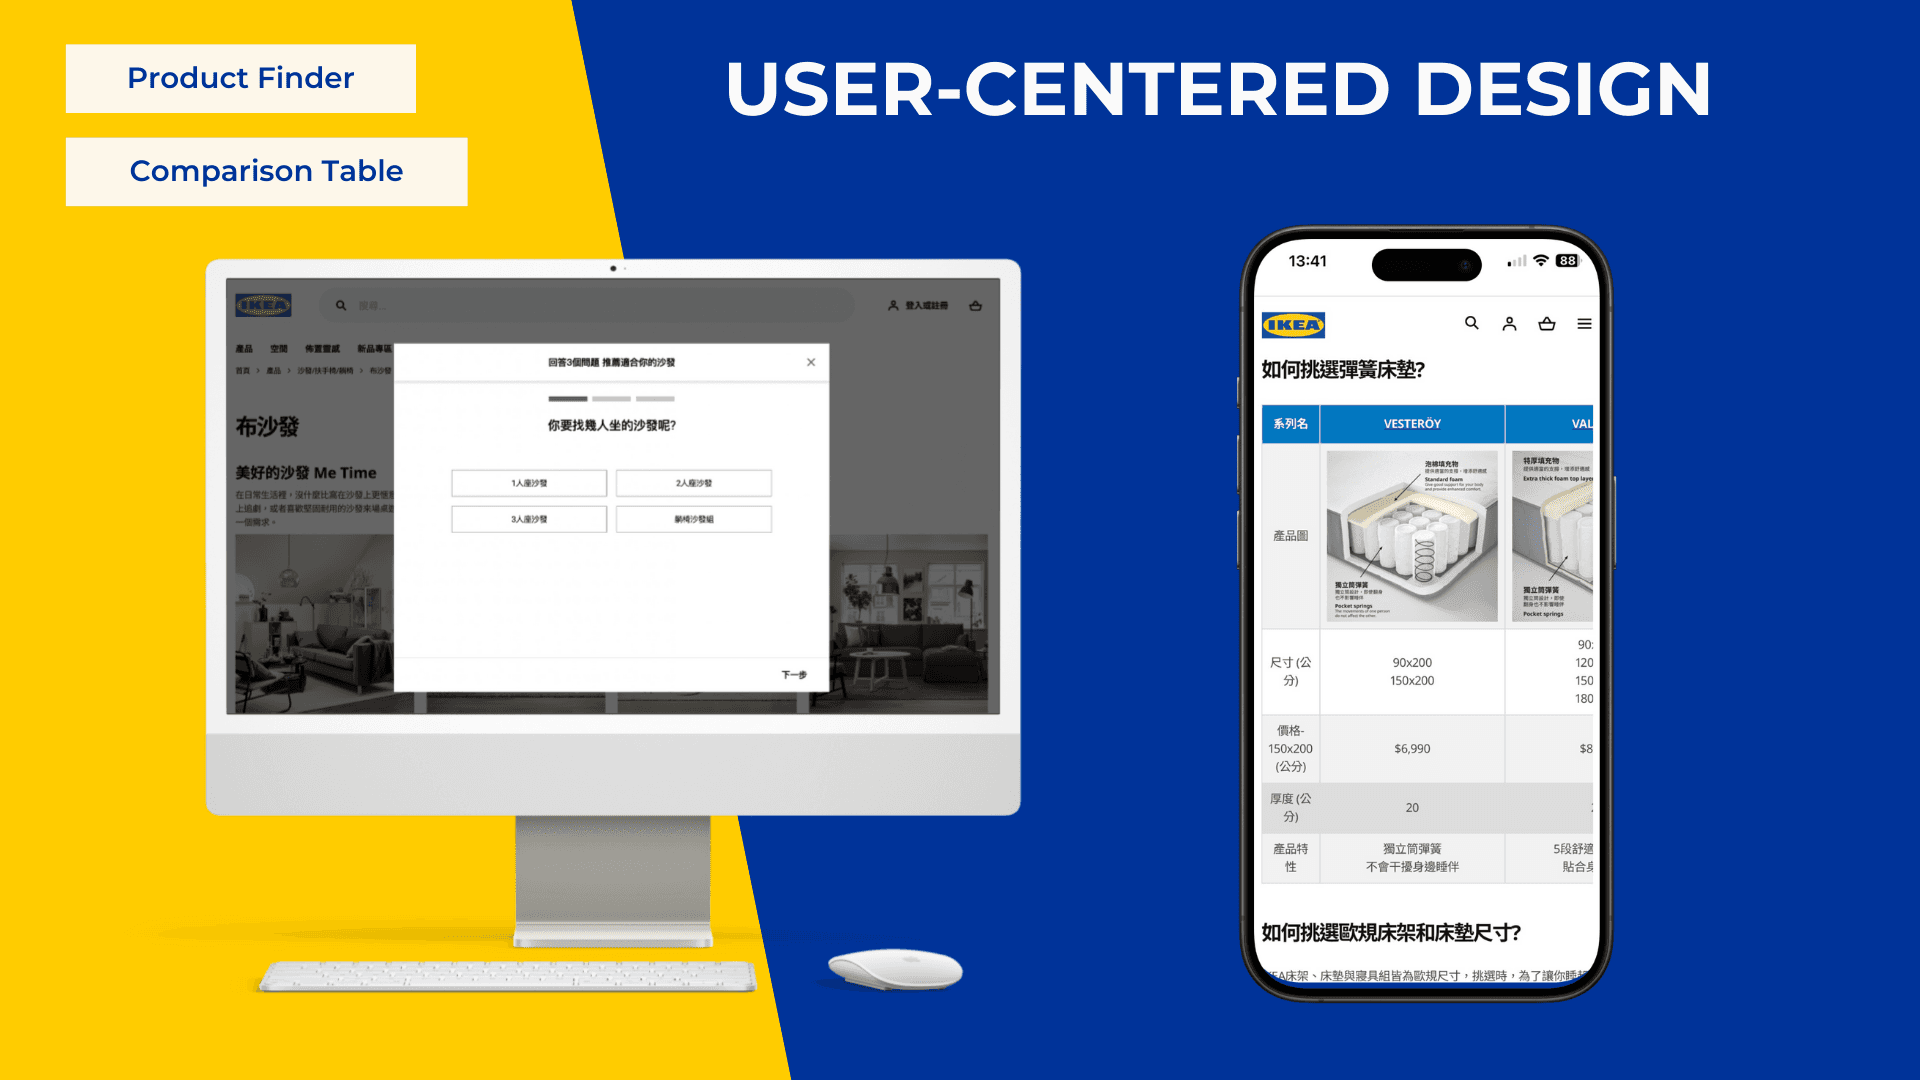
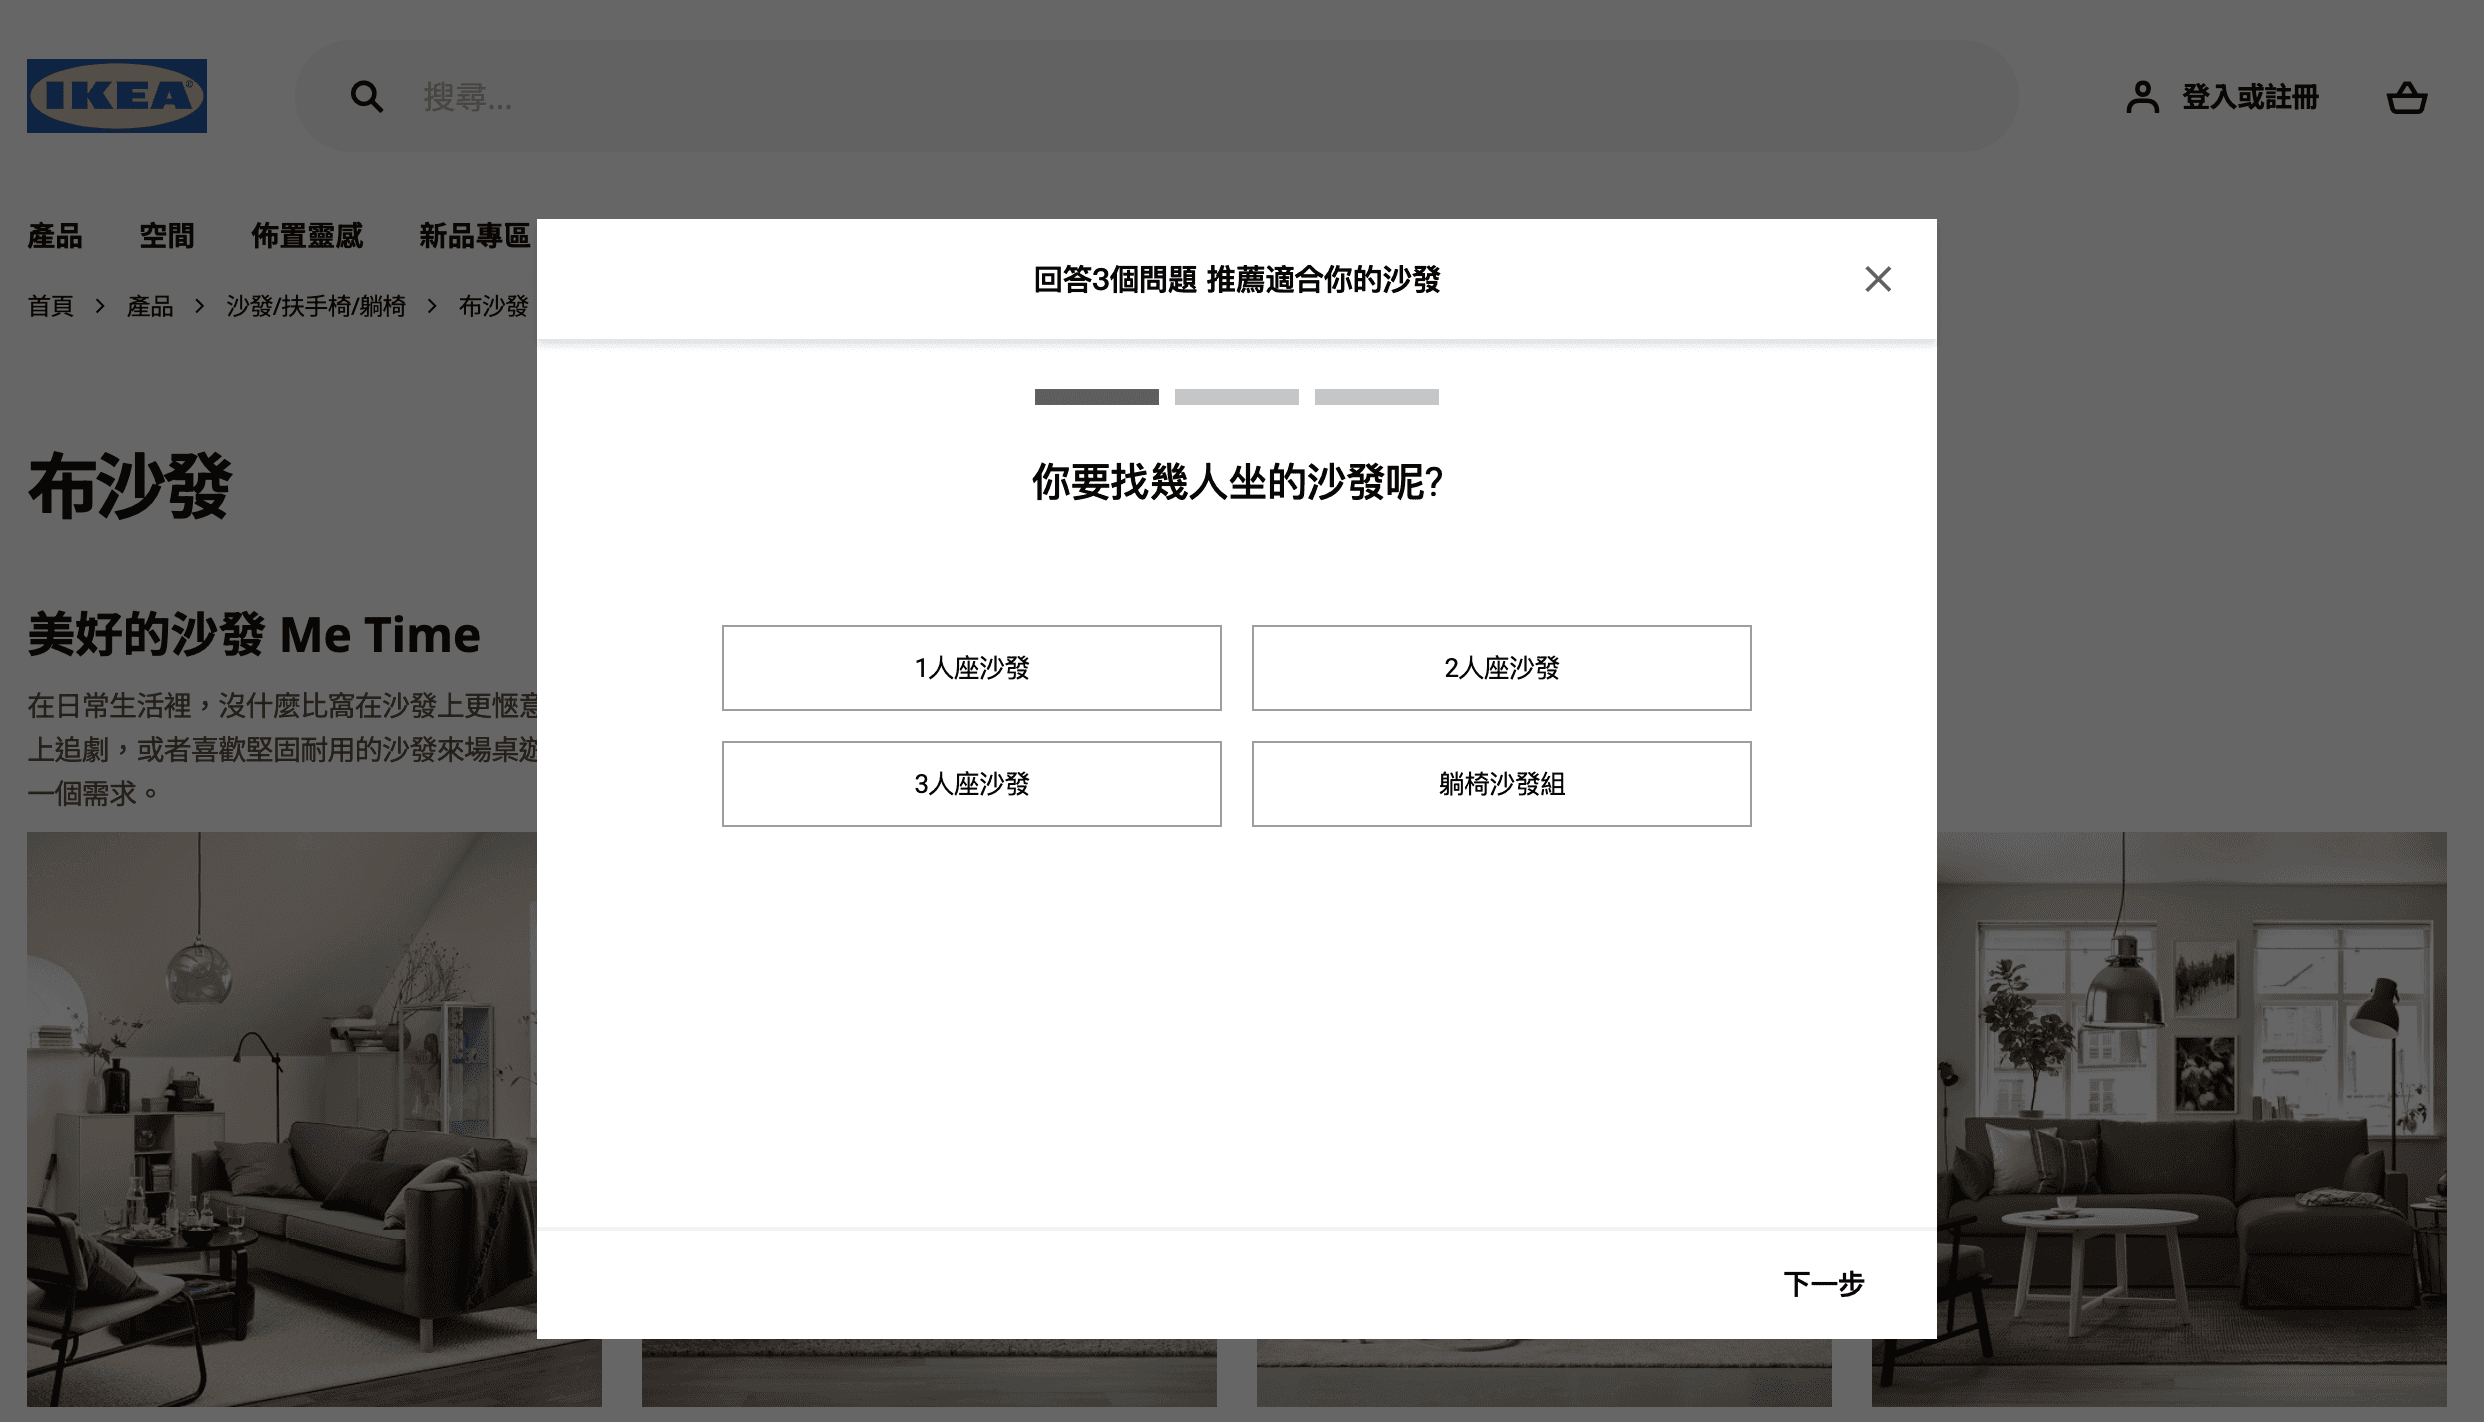
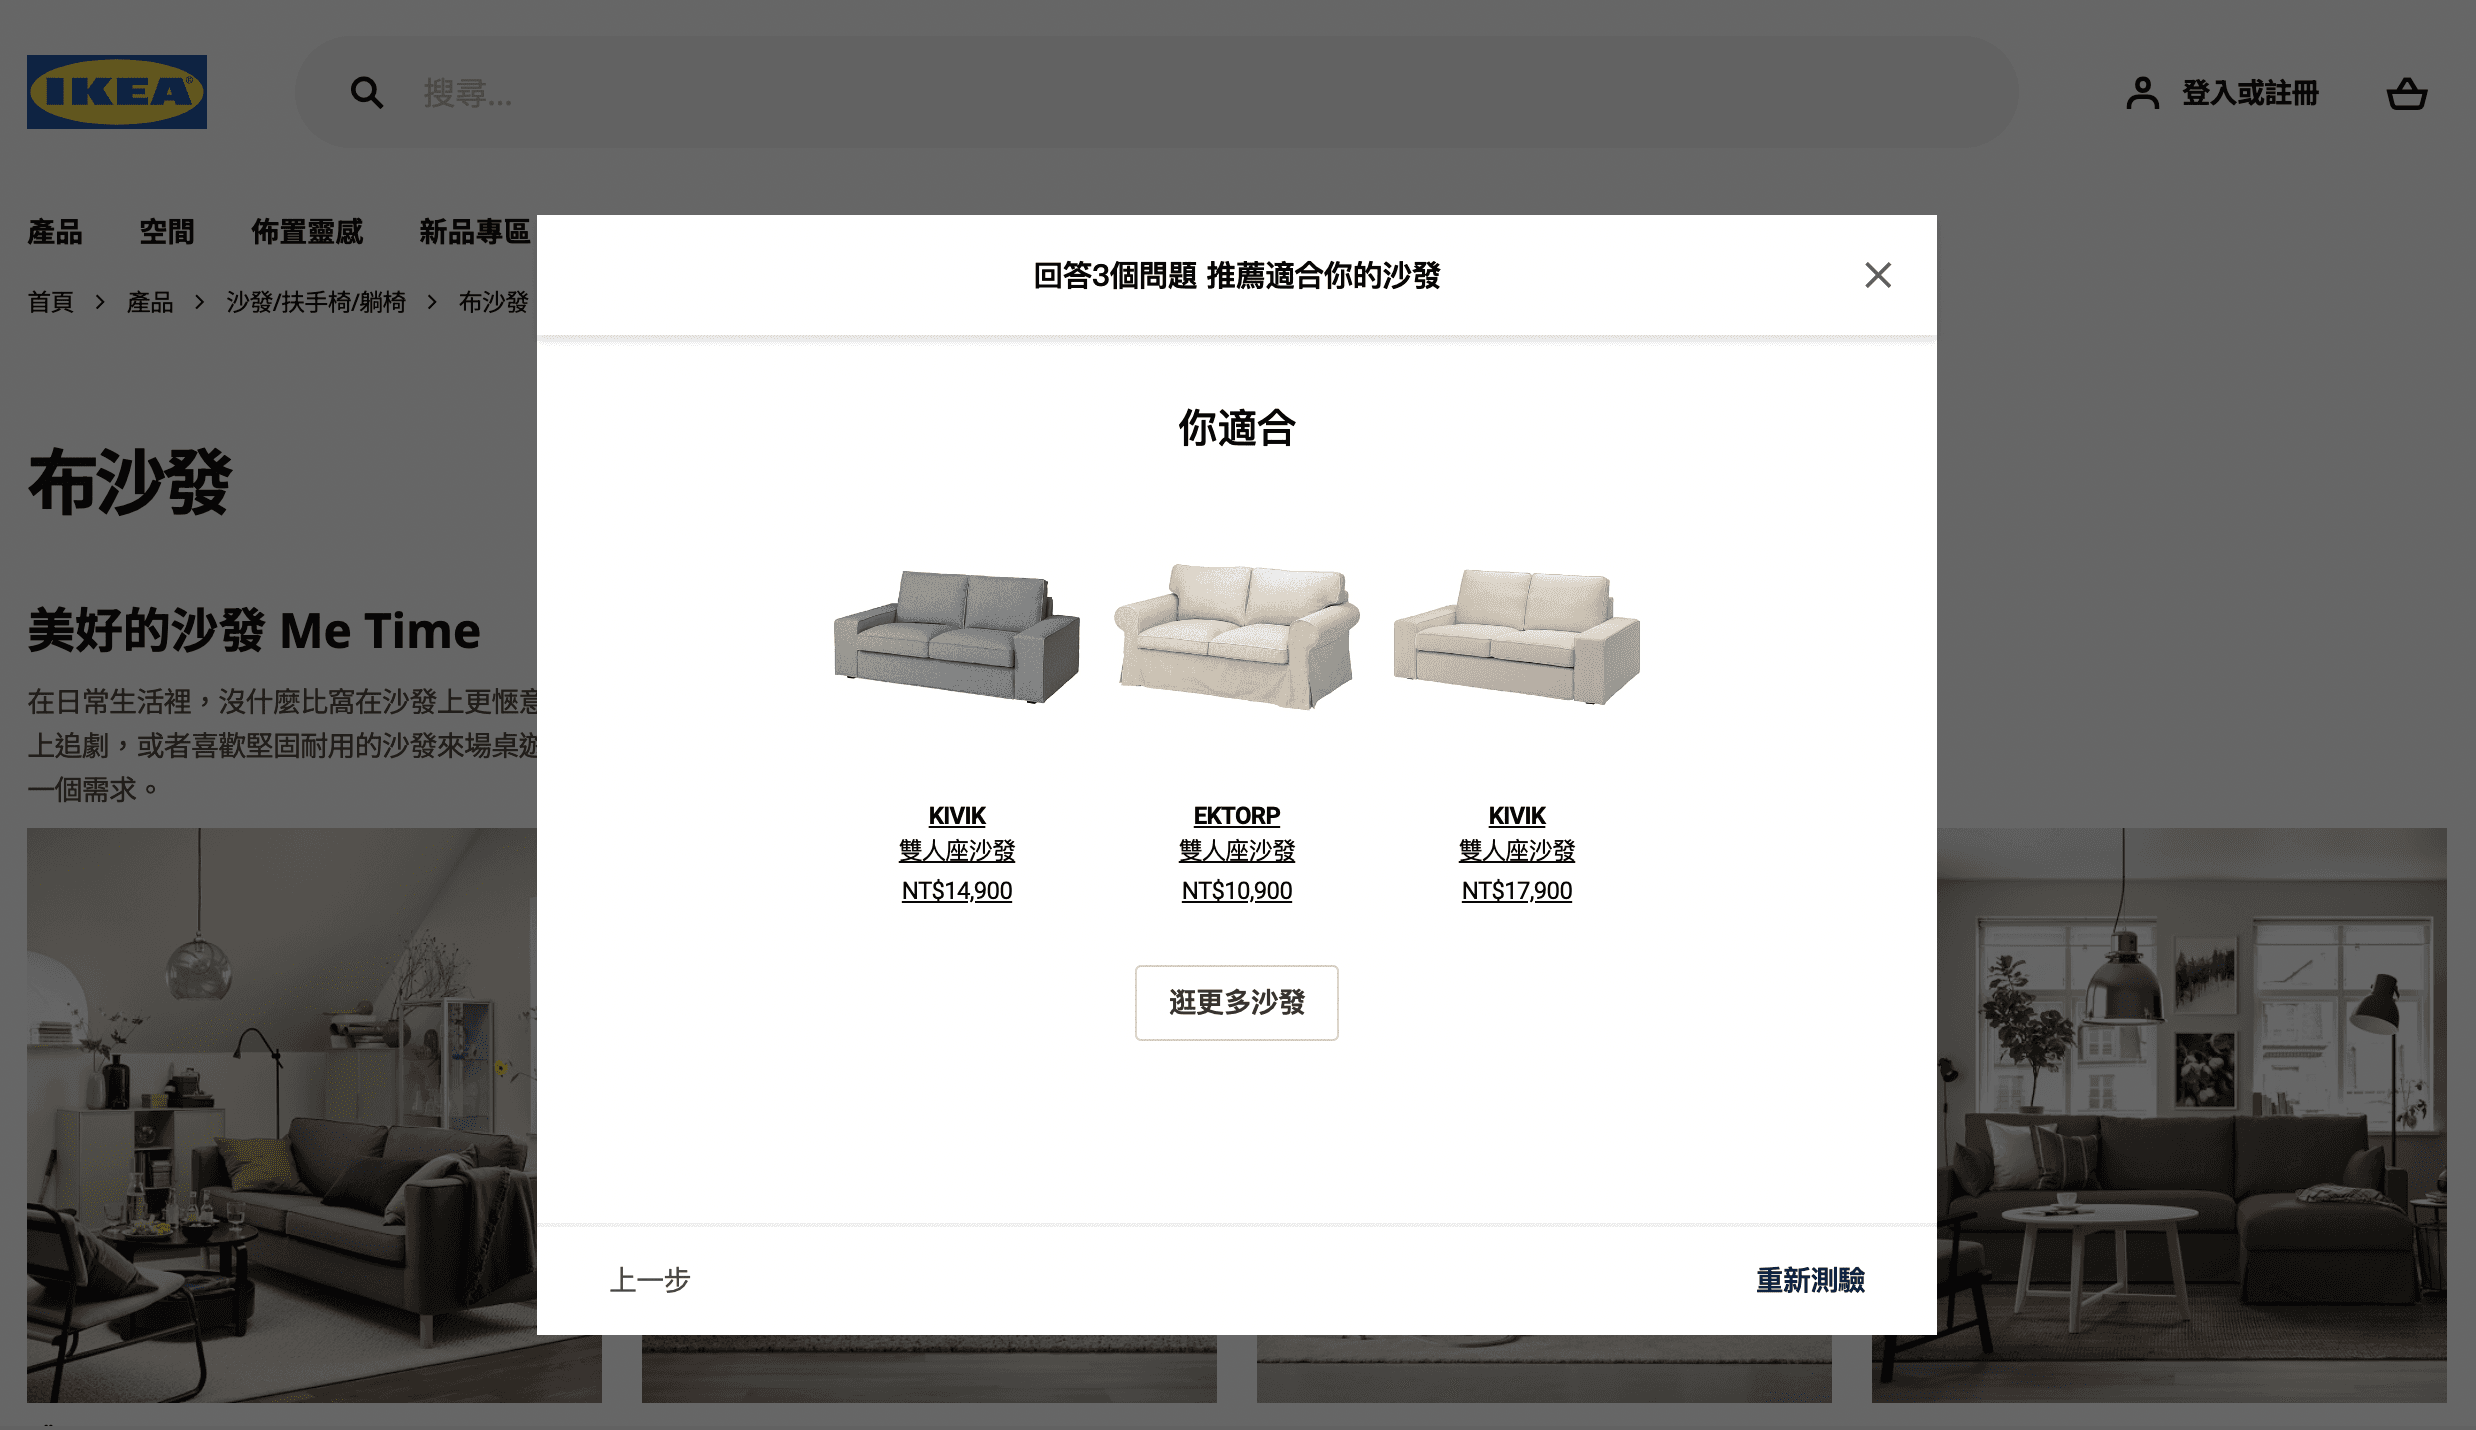
I discovered a quiz tool by Dynamic Yield that allowed us to ask a few questions and generate personalized recommendations for customers. It's essential to ask the right questions, and having access to relevant data feeds can greatly support this tool.
Then, I interviewed a co-worker with selling experience in-store. Additionally, I referred to examples from other brands to ensure how to utilize the quizzes effectively.
Result
Proactively sought opportunities to implement a new product finder (Quizzes) designed to help online customers efficiently discover products, resulting in an impressive increase of over 27.89% in the add-to-cart rate compared to the control group.
Data Source: Dynamic Yield
Learning
Data feeds are a crucial element in creating an excellent sales tool. Therefore, when utilizing personalized tools, we should consider the data structure, format, and value.
Exploring a new approach to selling and enhancing online shopping was an important task. Once we gain some experience, we can apply this tool to other product categories to identify differences and weaknesses, and find solutions.
Published date: 2022, End of September
Motivation
For certain products, shoppers may have difficulty fully understanding the product, and selecting it by themselves online may be a significant concern for them.
Challenge
It was difficult to provide detailed information on the materials, size, and thickness of mattresses all at once. There was too much information to digest and it made it challenging to make a decision.
Solution
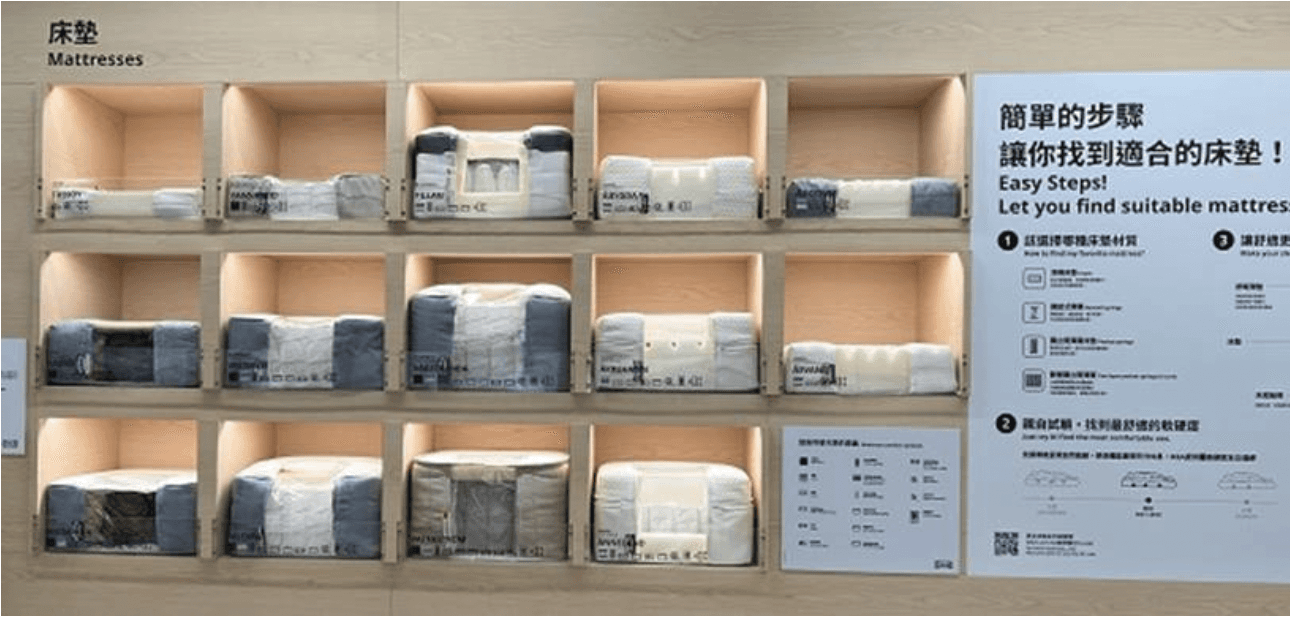
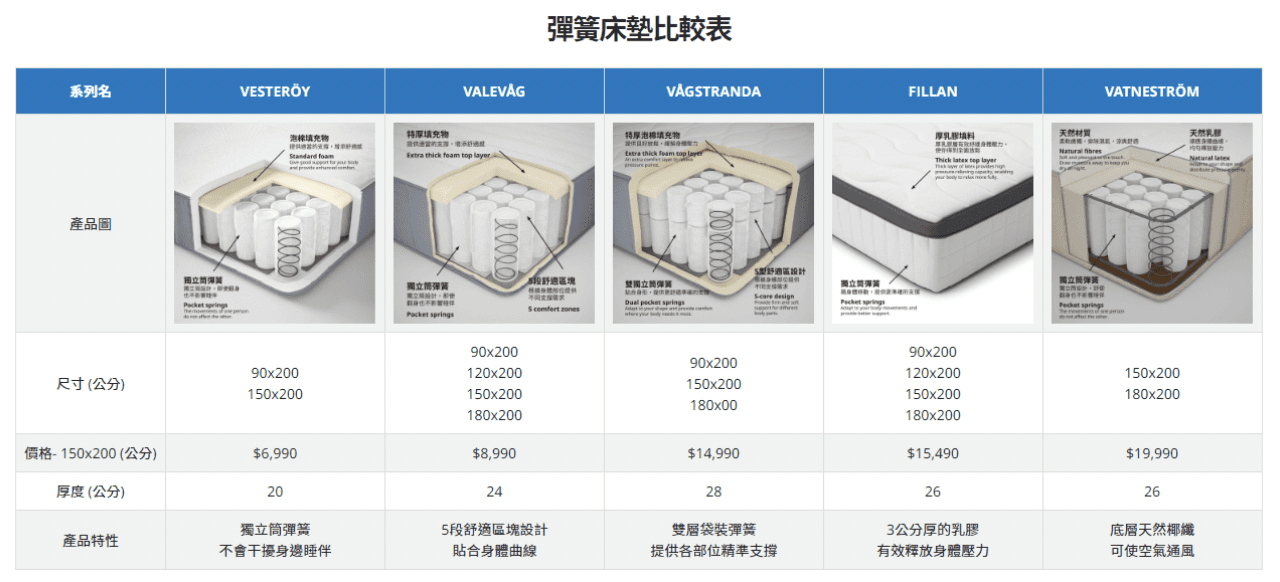
I visited the store to gain inspiration. Consequently, I created comparison tables online. Instead of displaying all mattresses, I selected key mattresses and showcased their main prices based on the most commonly sold size, as indicated by past sales reports.
Result
Achieved a growth rate of 16.59% in the add-to-cart rate and a significant increase in the average check by 5.0%.
Data Source: Google Analytics
Learning
I believe that online shoppers have concerns when they lack sufficient information or are unable to try out products. Therefore, we should provide useful information to encourage them to confidently add products to their carts. Simultaneously, this information should be presented in a simple and readable format.
Furthermore, I also considered mobile users. The comparison table was designed to be mobile-friendly, allowing customers to swipe right to view more columns.
